Multiple Ways of Assessing Threats to Water: Supply-Side and Demand-Side Problems
Multiple Ways of Assessing Threats to Water: Supply-Side and Demand-Side Problems
For some detailed general news coverage of water issues, see the 2010 Newsweek story (cover shown in the graphic above), as well as a special issue of National Geographic Magazine in 2010 devoted to a wide range of water issues.
FAO Video: Water 101 - Global Water Scarcity Trends:
For a great source for more details regarding the causes and projected consequences of the global water crisis, see the UN Water's 2011 Policy Brief
For a great source for more details regarding the causes and projected consequences of the global water crisis, see the UN Water's 2011 Policy Brief
Some Basics of Water Availability: Saltwater, Freshwater, Groundwater, and Surface Water

Click image for larger view
One of the more frequently cited statistics in discussions of water availability is the fact that only around 2.5% of the Earth's water is freshwater. The overwhelming amount of water is saline or salt water, mostly found in the oceans.
Of the 2.5% of freshwater available for the support of human life, agriculture, and most forms of non-ocean life, 30.1% is groundwater. Groundwater is the water stored deep beneath the Earth's surface in underground aquifers. Another 68.6% of all freshwater is stored in glaciers and polar caps. That leaves only 1.3% of the total freshwater on Earth is in surface watersources such as lakes, rivers, and streams. But it is surface water humans and other species rely upon for their biological needs.
Even the bulk of surface water on Earth is found in snow and ice - approximately 73.1%. Surface water found in lakes, rivers and streams accounts for just over another 20%.
And yet, when we (humans) think about our needs for water we spend most of our time thinking about the surface water found in lakes and rivers and the vast watersheds within which they and their tributaries are found. It is on the basis of a consideration of such a narrow set of all freshwater resources that we plan the location of our cities, derive most of our drinking water, build waterways for transporting people and goods, pipe vast quantities very long distances for agricultural purposes (e.g., from Lake Mead to the California Central Valley), and worry most focally about whenever we do pause to worry about water pollution and water-related environmental degradation.
Graphic Source: Igor Shiklomanov's chapter "World fresh water resources" in Peter H. Gleick (editor), 1993, Water in Crisis: A Guide to the World's Fresh Water Resources (Oxford University Press, New York). A detailed discussion of these and many more elementary aspects of the hydrologic cycle can be found at the website for the US Geological Service, where this graphic was found.
Ground Water and Two Big Threats from the Disruption of the Hydrologic Cycle
Click EPA image for larger view
Groundwater is the hidden resource behind what is visible in any ordinary landscape. Groundwater located in shallow and deep aquifers feeds the lakes and streams. Rainwater infiltrates the subsoil and replenishes groundwater supplies. Just how much replenishment of aquifers within the normal operation of the hydrologic cycle depends on a number of variables. Some precipitation evaporates, especially under arid and hot conditions. Some water flows into streams and rivers but does not infiltrate deeply. It becomes runoff that moves directly into the ocean, taking a greater part of the available water from the hydrologic cycle that might have remained within the stock of available freshwater.
Two major sources of disruption of the hydrological cycle are warming produced by climate change and features of the "built environment" that induce more runoff.
Two major sources of disruption of the hydrological cycle are warming produced by climate change and features of the "built environment" that induce more runoff.
FAO Map of Current Sites of Physical and Economic Water Scarcity
click image for larger view
Things are changing globally. On the one hand, there is good news. As the discusion below on the 7th Millenium Goal indicates, fewer people globally lack access to potable water than they did 30 years ago. Indeed, the percentage was cut in half. On the other hand, long term trends are not encouraging.
Among the important facts emphasized by the Food and Agriculture Organization (FAO) are these two:
The map on your right and its included commentary tells a more complex story. For more information from the FAO's collected research on the global status and usage patterns of water see the FAO's Water webpage.
Source: Food and Agriculture Organization of the United Nations (FAO) and UN-Water
Progress Toward Millennium Development Goal 7: halving the proportion of the population without sustainable access to safe drinking water and basic sanitation

click image for full report
The most recent WHO/UNICEF Joint Monitoring Programme for Water Supply and Sanitation (JMP) biennial report on the progress towards the drinking-water and sanitation target under Millennium Development Goal 7 - halving the proportion of the population without sustainable access to safe drinking water and basic sanitation between 1990 and 2015 - . was met in 2010, five years ahead of schedule. However, an estimated 780 million still lacked safe drinking water in 2010, and the world is unlikely to meet the MDG sanitation target.
While there is much good news in this 2012 report, the fact remains that severe water stress affecting 1/3 of the world's population is expected to double to 2/3 by 2025. (See FAO data above in their Water 101 video and the other trend projection maps above).
While there is much good news in this 2012 report, the fact remains that severe water stress affecting 1/3 of the world's population is expected to double to 2/3 by 2025. (See FAO data above in their Water 101 video and the other trend projection maps above).
It's Important to Know Where Rates of Use Will Exceed Rates of Recharge

Some key facts and projections are available from the UNWater.org webpage where important statistics and maps from various sources are collected:
Climate Change Will Disproportionately Affect Regions that Depend on Rainwater for Agriculture

The consensus is that there will be more or less the same aggregate available water resources in 2050 as there was in 2007, but there will be far more people on the planet. As the maps projecting through 2025 indicate, the reduced availability of freshwater for all uses will not be distributed equally across the globe.
The main areas to face greater losses are the Equatorial regions, which are already among the most water stressed areas. These areas tend to be the parts of the world most dependent on rainfall rather than irrigation as the basis for agriculture. Rain dependent agricultural areas are at much greater risk of crop failure. They are among the least productive farmlands in the world. According to the FAO, irrigation increases yields of most crops by 100 to 400 percent, and irrigated agriculture currently contributes to 40 percent of the world's food production. The hottest, driest regions of the world, then, are already at a significant disadvantage in the efforts to meet their own food needs, but even as early as 2020, the Intergovernmental Panel on Climate Change predicts yields from rain-dependent agriculture could be down by 50 percent. (Source: Unwater.org).
The main areas to face greater losses are the Equatorial regions, which are already among the most water stressed areas. These areas tend to be the parts of the world most dependent on rainfall rather than irrigation as the basis for agriculture. Rain dependent agricultural areas are at much greater risk of crop failure. They are among the least productive farmlands in the world. According to the FAO, irrigation increases yields of most crops by 100 to 400 percent, and irrigated agriculture currently contributes to 40 percent of the world's food production. The hottest, driest regions of the world, then, are already at a significant disadvantage in the efforts to meet their own food needs, but even as early as 2020, the Intergovernmental Panel on Climate Change predicts yields from rain-dependent agriculture could be down by 50 percent. (Source: Unwater.org).
Map of Projected Physical and Economic Water Scarcity in 2025
click image for larger view
You can read his intriguing and illuminating paper, "Water Scarcity: Fact or Fiction?" from the website of the 4th International Crop Science Congress
Another Map Showing Additional Information Regarding Vulnerabilities
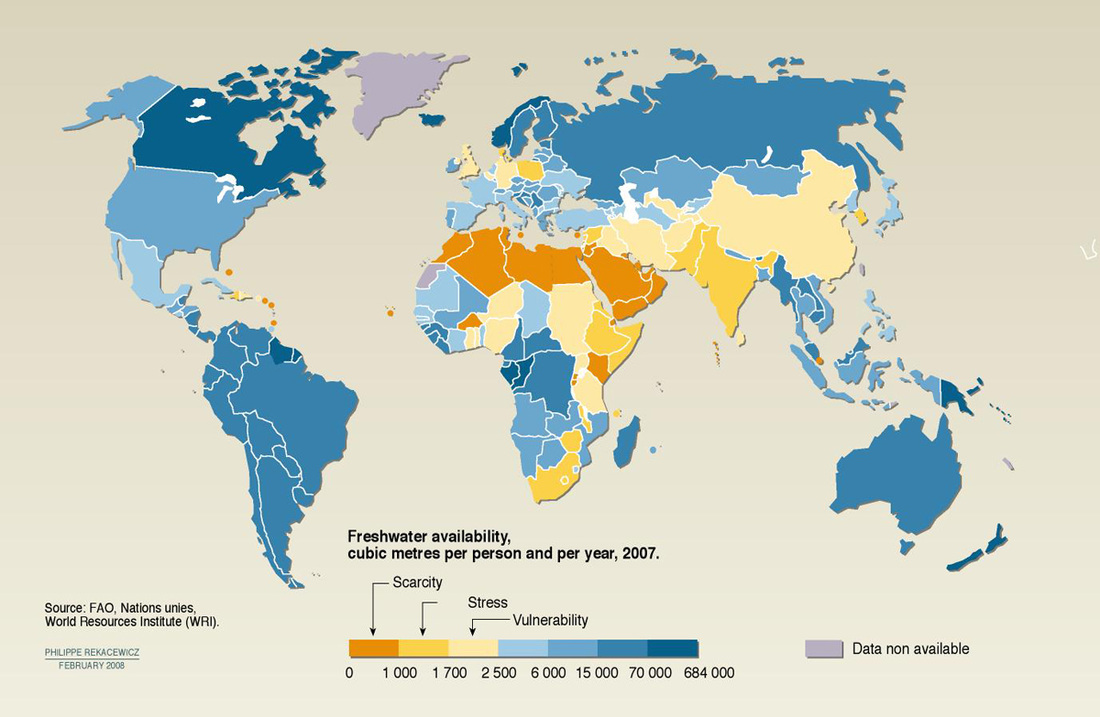
click image for larger view
The UN's website on the global water outlook makes the following two claims:
Source: Vital Water Graphics. UNEP
Global Trends in Groundwater Depletion
click image for larger view
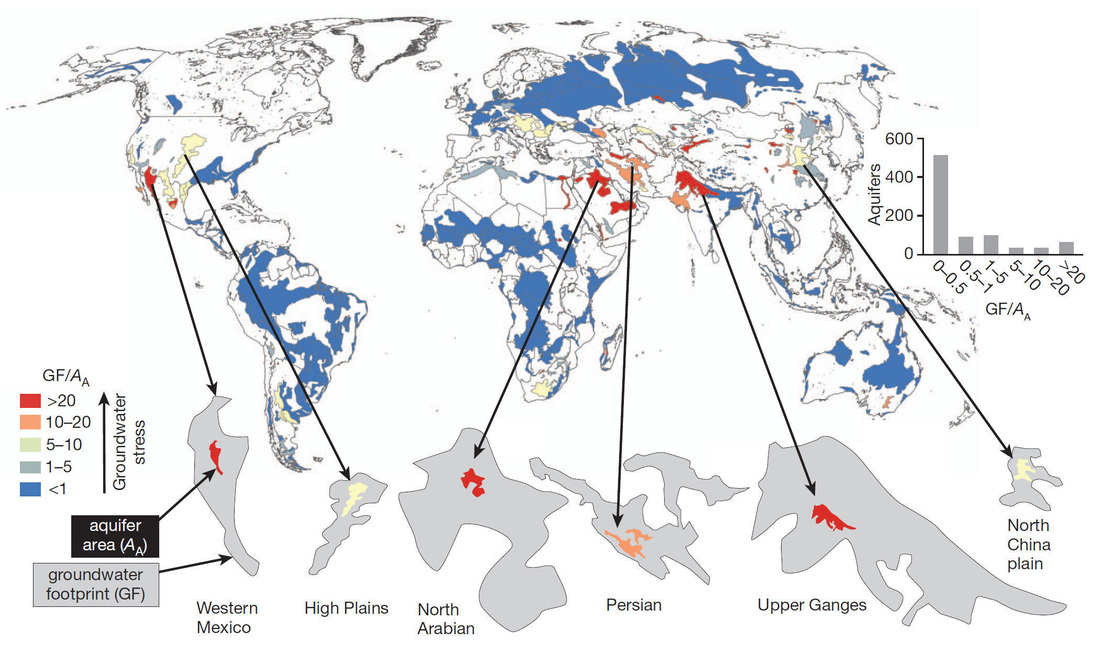
A 2012 study of global groundwater depletion published in Naturedemonstrates how some of the planet's largest underground aquifers are now being depleted by irrigation and other uses faster than they can be replenished by rainwater. The Abstract of the paper, "Water balance of global aquifers revealed by groundwater footprint," summarizes the key finding:
"Most assessments of global water resources have focused on surface water, but unsustainable depletion of groundwater has recently been documented on both regional and global scales. It remains unclear how the rate of global groundwater depletion compares to the rate of natural renewal and the supply needed to support ecosystems. Here we define the groundwater footprint (the area required to sustain groundwater use and groundwater-dependent ecosystem services) and show that humans are overexploiting groundwater in many large aquifers that are critical to agriculture, especially in Asia and North America. We estimate that the size of the global groundwater footprint is currently about 3.5 times the actual area of aquifers and that about 1.7 billion people live in areas where groundwater resources and/or groundwater-dependent ecosystems are under threat. That said, 80 per cent of aquifers have a groundwater footprint that is less than their area, meaning that the net global value is driven by a few heavily overexploited aquifers."
The map compares the usage footprint in each of these key areas with the actual rainfall the aquifer gets. The orange and red areas are areas of overexploitation, while the blue areas show where there is more rainfall replenishment than water uptake by humans.
Where Does All the Water Go?

Our modern industrial system of agriculture poses still further challenges both because of its impact on our ability to meet our needs for freshwater and because it is in itself an increasingly carbon-intensive enterprise. The use of fertilizers and pesticides that has been largely responsible for the massive increase in yield per acre since WWII, but it requires far more water per acre than traditional forms of agriculture.
The FAO estimates that 70% of the world's water is used for agricultural purposes. The graphic on the right shows that it takes approximately 15,000 litres of water to produce one kilogram of meat. That compares to approximately 1,500 litres to produce a kilogram of wheat. Approximately 3,000 litres per day are needed to satisfy a person's daily nutritional needs - that estimate, of course, depends on the foods that are used to meet those needs.
One recent study suggests that in some places energy production may be overtaking agriculture as the primary user of water. Burning Our Rivers: The Water Footprint of Electricity, a 2012 report by River Network attempts to summarize what is known about the water footprint of various modes of electrical power production. Here are some of their findings in the US setting. One striking conclusion is that in the US "electricity production by coal, nuclear and natural gas power plants is the fastest-growing use of freshwater in the U.S., accounting for more than about ½ of all fresh, surface water withdrawals from rivers and lakes. This is more than any other economic sector, including agriculture."
"VIrtual Water" Adjustments to National Per Capita Water Footprint Estimates
click PNAS graphic for larger view
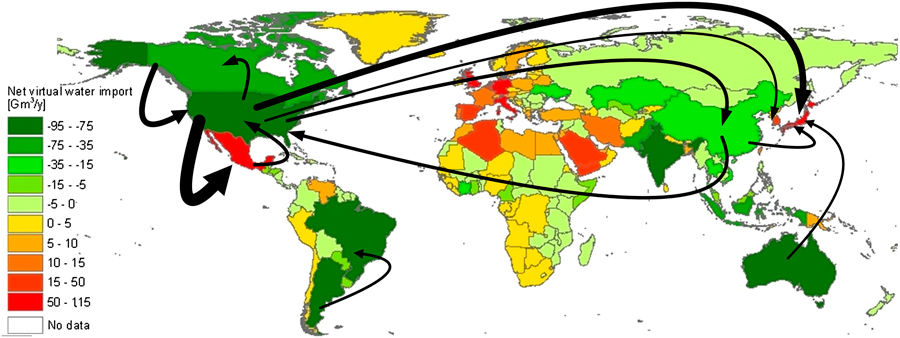
A 2012 study by Hoekstra and Mekonnen takes a comprehensive look at the global water footprint (WF) by nations. It examines first the consumptive use of rainwater (green WF) and ground and surface water (blue WF) and volumes of water polluted (gray WF). Among the findings of the study, are estimates of the largest components of water consumption: e.g., "cereal products gives the largest contribution to the WF of the average consumer (27%), followed by meat (22%) and milk products (7%). The volume and pattern of consumption and the WF per ton of product of the products consumed are the main factors determining the WF of a consumer."
But one of the key points made in the study is that the national average per capita WF can be estimated from both a production and consumption perspective. The difference lies in the fact that international "virtual water" flows are estimated based on trade in agricultural and industrial commodities. About one-fifth of the global WF involves production for export. The graphic from the paper published in the Proceedings of the National Academy of Sciences (PNAS), provides a spatial analysis of water consumption and pollution based on worldwide trade indicators, demographic data and water-usage statistics.
The significance of virtual water cannot be underemphasized. Some countries assessed from a water production perspective initially apear to use less water per capita, but that number increases once virtual water is included, for example the water consumed in one nation but "produced" in another nation and exported in the form of agricultural products. As the authors note, "The study illustrates the global dimension of water consumption and pollution by showing that several countries heavily rely on foreign water resources and that many countries have significant impacts on water consumption and pollution elsewhere." So, for example, a significant amount of the water consumption that would show up in China's column, if data are not adjusted to reflect the ultimate locus of consumption, shows up in the US column once the adjustment is made for virtual water. In effect, some countries "offshore" water overdraft and pollution by consuming products from international trade.
The Components of the Water Footprint and the Impact of Biofuels
The way we measure the water footprint of various crops depends on certain assumptions regarding what it actually means when we say some crop requires some amount of water. Not all agricultural uses of water are created equal. Some uses badly degrade the water while others do little or no enduring damage. A study of the impact on water from 12 biofuels reveals some significant differences among them.
The authors of the study draw an important set of distinctions among three types of water footprint (WF):
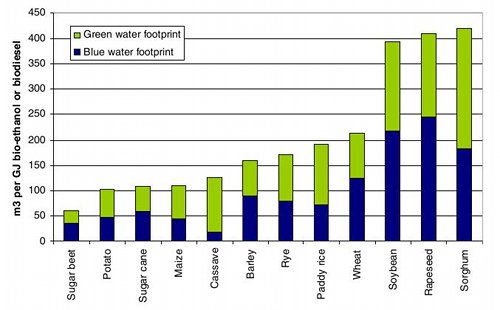
"The WF consists of 3 components: the green WF, the blue WF, and the gray WF. The green WF refers to rainwater that evaporated during production, mainly during crop growth. The blue WF refers to surface and groundwater for irrigation evaporated during crop growth. The gray WF is the volume of water that becomes polluted during production, defined as the amount of water needed to dilute pollutants discharged into the natural water system to the extent that the quality of the ambient water remains above agreed water quality standards.”
The chart from the paper appearing in the Proceedings of the National Academy of Sciences shows the comparative blue and green water impact of the major biofuels in global production. The results of the study are reported in cubic meters per giga-Joule of energy produced (m3/GJ). In more familiar terms, a liter of ethanol made from sugar beets uses "just" 1,400 litres of water, while rapeseed or soya required 14,000 liters of water to make just one liter of biodiesel.
The authors of the study draw an important set of distinctions among three types of water footprint (WF):
"The WF consists of 3 components: the green WF, the blue WF, and the gray WF. The green WF refers to rainwater that evaporated during production, mainly during crop growth. The blue WF refers to surface and groundwater for irrigation evaporated during crop growth. The gray WF is the volume of water that becomes polluted during production, defined as the amount of water needed to dilute pollutants discharged into the natural water system to the extent that the quality of the ambient water remains above agreed water quality standards.”
The chart from the paper appearing in the Proceedings of the National Academy of Sciences shows the comparative blue and green water impact of the major biofuels in global production. The results of the study are reported in cubic meters per giga-Joule of energy produced (m3/GJ). In more familiar terms, a liter of ethanol made from sugar beets uses "just" 1,400 litres of water, while rapeseed or soya required 14,000 liters of water to make just one liter of biodiesel.


Comments
Post a Comment